New Generation Tuner's
Menu

Performance

Calibration for a healthy car with hardware that can support it. The goal is performance that’s consistent and drivable, every time.
Discuss your car
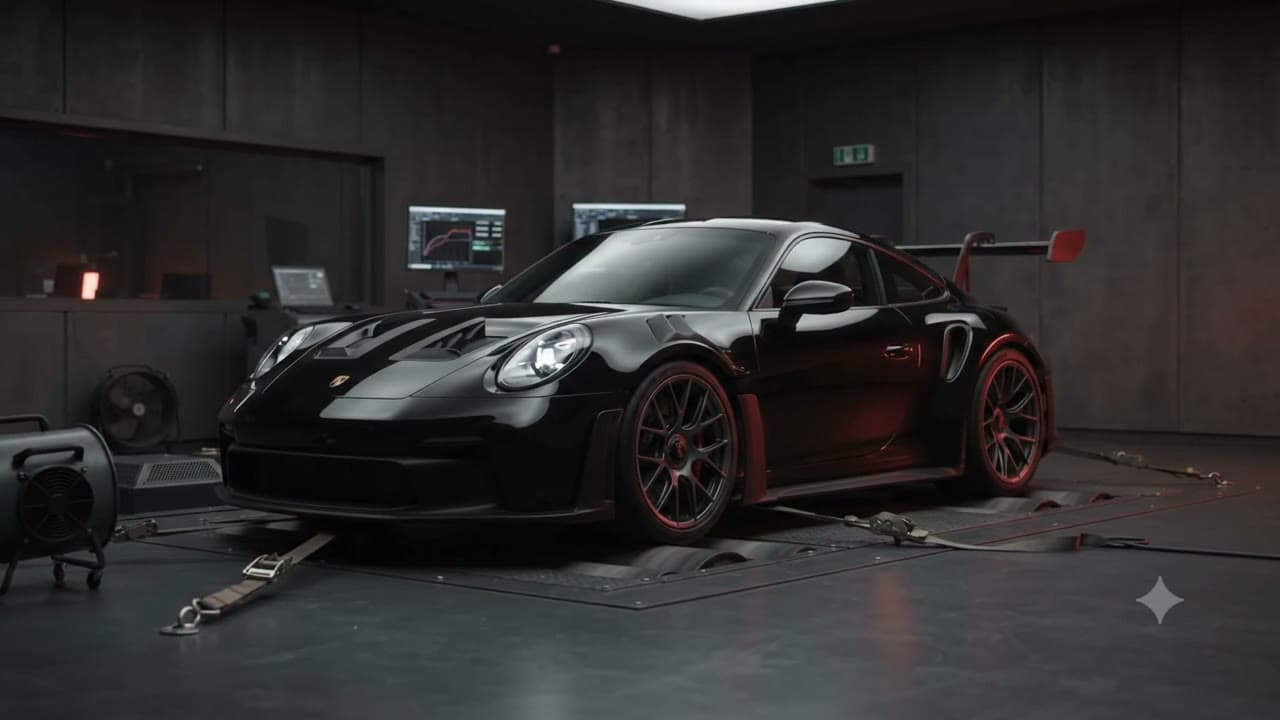
A sports coupé strapped to a chassis dynamometer, with cooling fans and a monitor in the background.Illustrative

Before any calibration

  1. 01

    Health first

    Fault memory, live data and the condition of the engine are checked before any calibration. Faults are fixed first, not tuned around.

  2. 02

    Original software kept

    The factory software is read and archived before anything is written, so it can be restored.

  3. 03

    Calibrated to the hardware

    Changes match the engine, fitted parts, fuel and the way the car is used — not a generic file.

  4. 04

    Verified afterwards

    Fault memory and live data are checked again, with a measured assessment where it’s appropriate.

  • A sports coupé strapped to a chassis dynamometer, with cooling fans and a monitor in the background.Illustrative

    Calibration tables: fuel, timing, boost, limits

    Remapping and race tuning

    Vehicle-specific engine calibration, from road remaps to track-focused race tuning, on a healthy engine with hardware that can support it.
    • A health check and fault-memory read before any calibration work
    • Reading and archiving the original software so it can be restored
    • Calibration matched to the engine, hardware, fuel and how the car is used

Performance lab

Measured power and torque, before and after calibration work, with the test conditions that make the numbers meaningful.

No measured results are published yet.

The chart shows demonstration curves on a relative scale. It is not a vehicle, a measurement or a typical gain. Verified records will appear here with the vehicle, engine, fuel, test method and work performed.

Results vary with vehicle, hardware, fuel, condition, calibration and measurement method. Figures from different dynamometers or correction standards are not directly comparable.

  • Before
  • After
Demonstration dataPower against engine speed (demonstration data)Before and after curves from 1500 to 6500 rpm. Use the engine speed slider below the chart to read values.DEMONSTRATION05010015020020003000400050006000Engine speed (rpm)Power (% of baseline peak)
4500 rpmBefore 75.5 % of baseline peakAfter 79 % of baseline peak
Demonstration curves only. Relative scale; no vehicle was measured.

Responsible tuning

Modifying a vehicle can affect its warranty, insurance and roadworthiness. Tell your insurer about changes, and check the regulations where you drive.

Emissions-control equipment stays fitted and working. Work that removes or disables it, or hides emissions faults, isn’t offered.

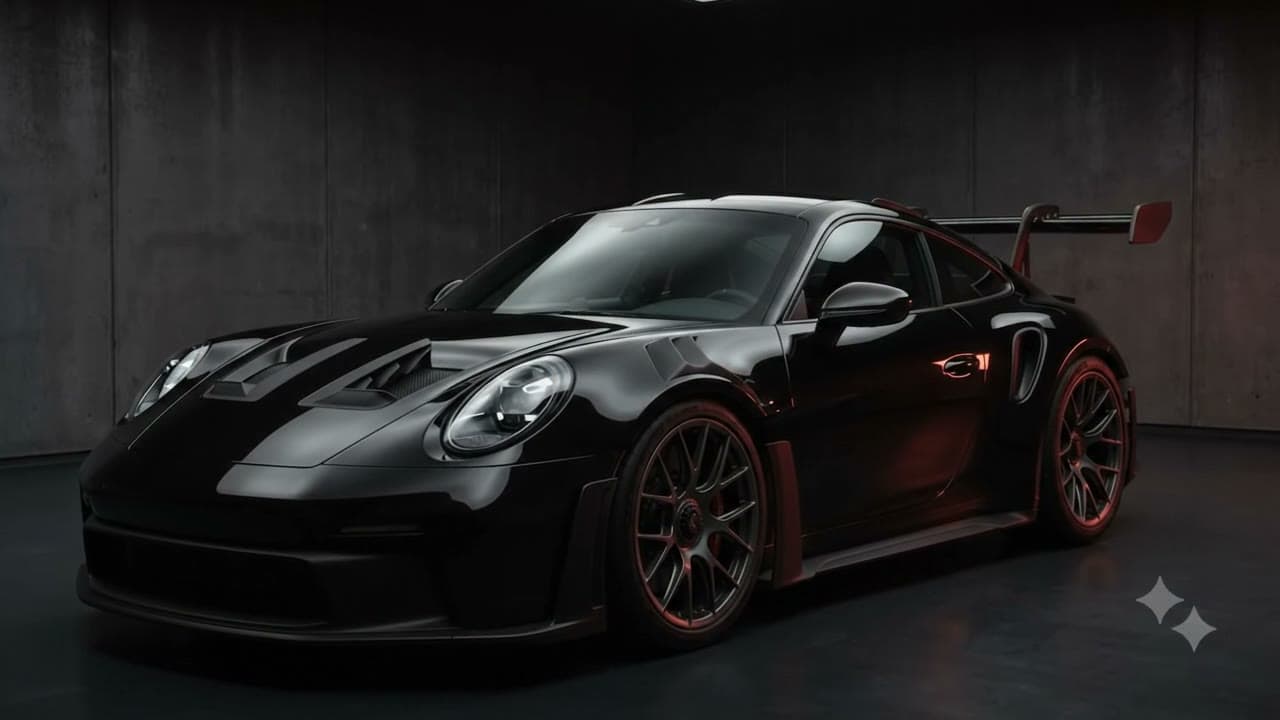
A black sports coupé standing in a dim studio under a single overhead light.Illustrative

What do you want from the car?

Describe the symptoms or the goal, with the make and model. That’s enough to start.